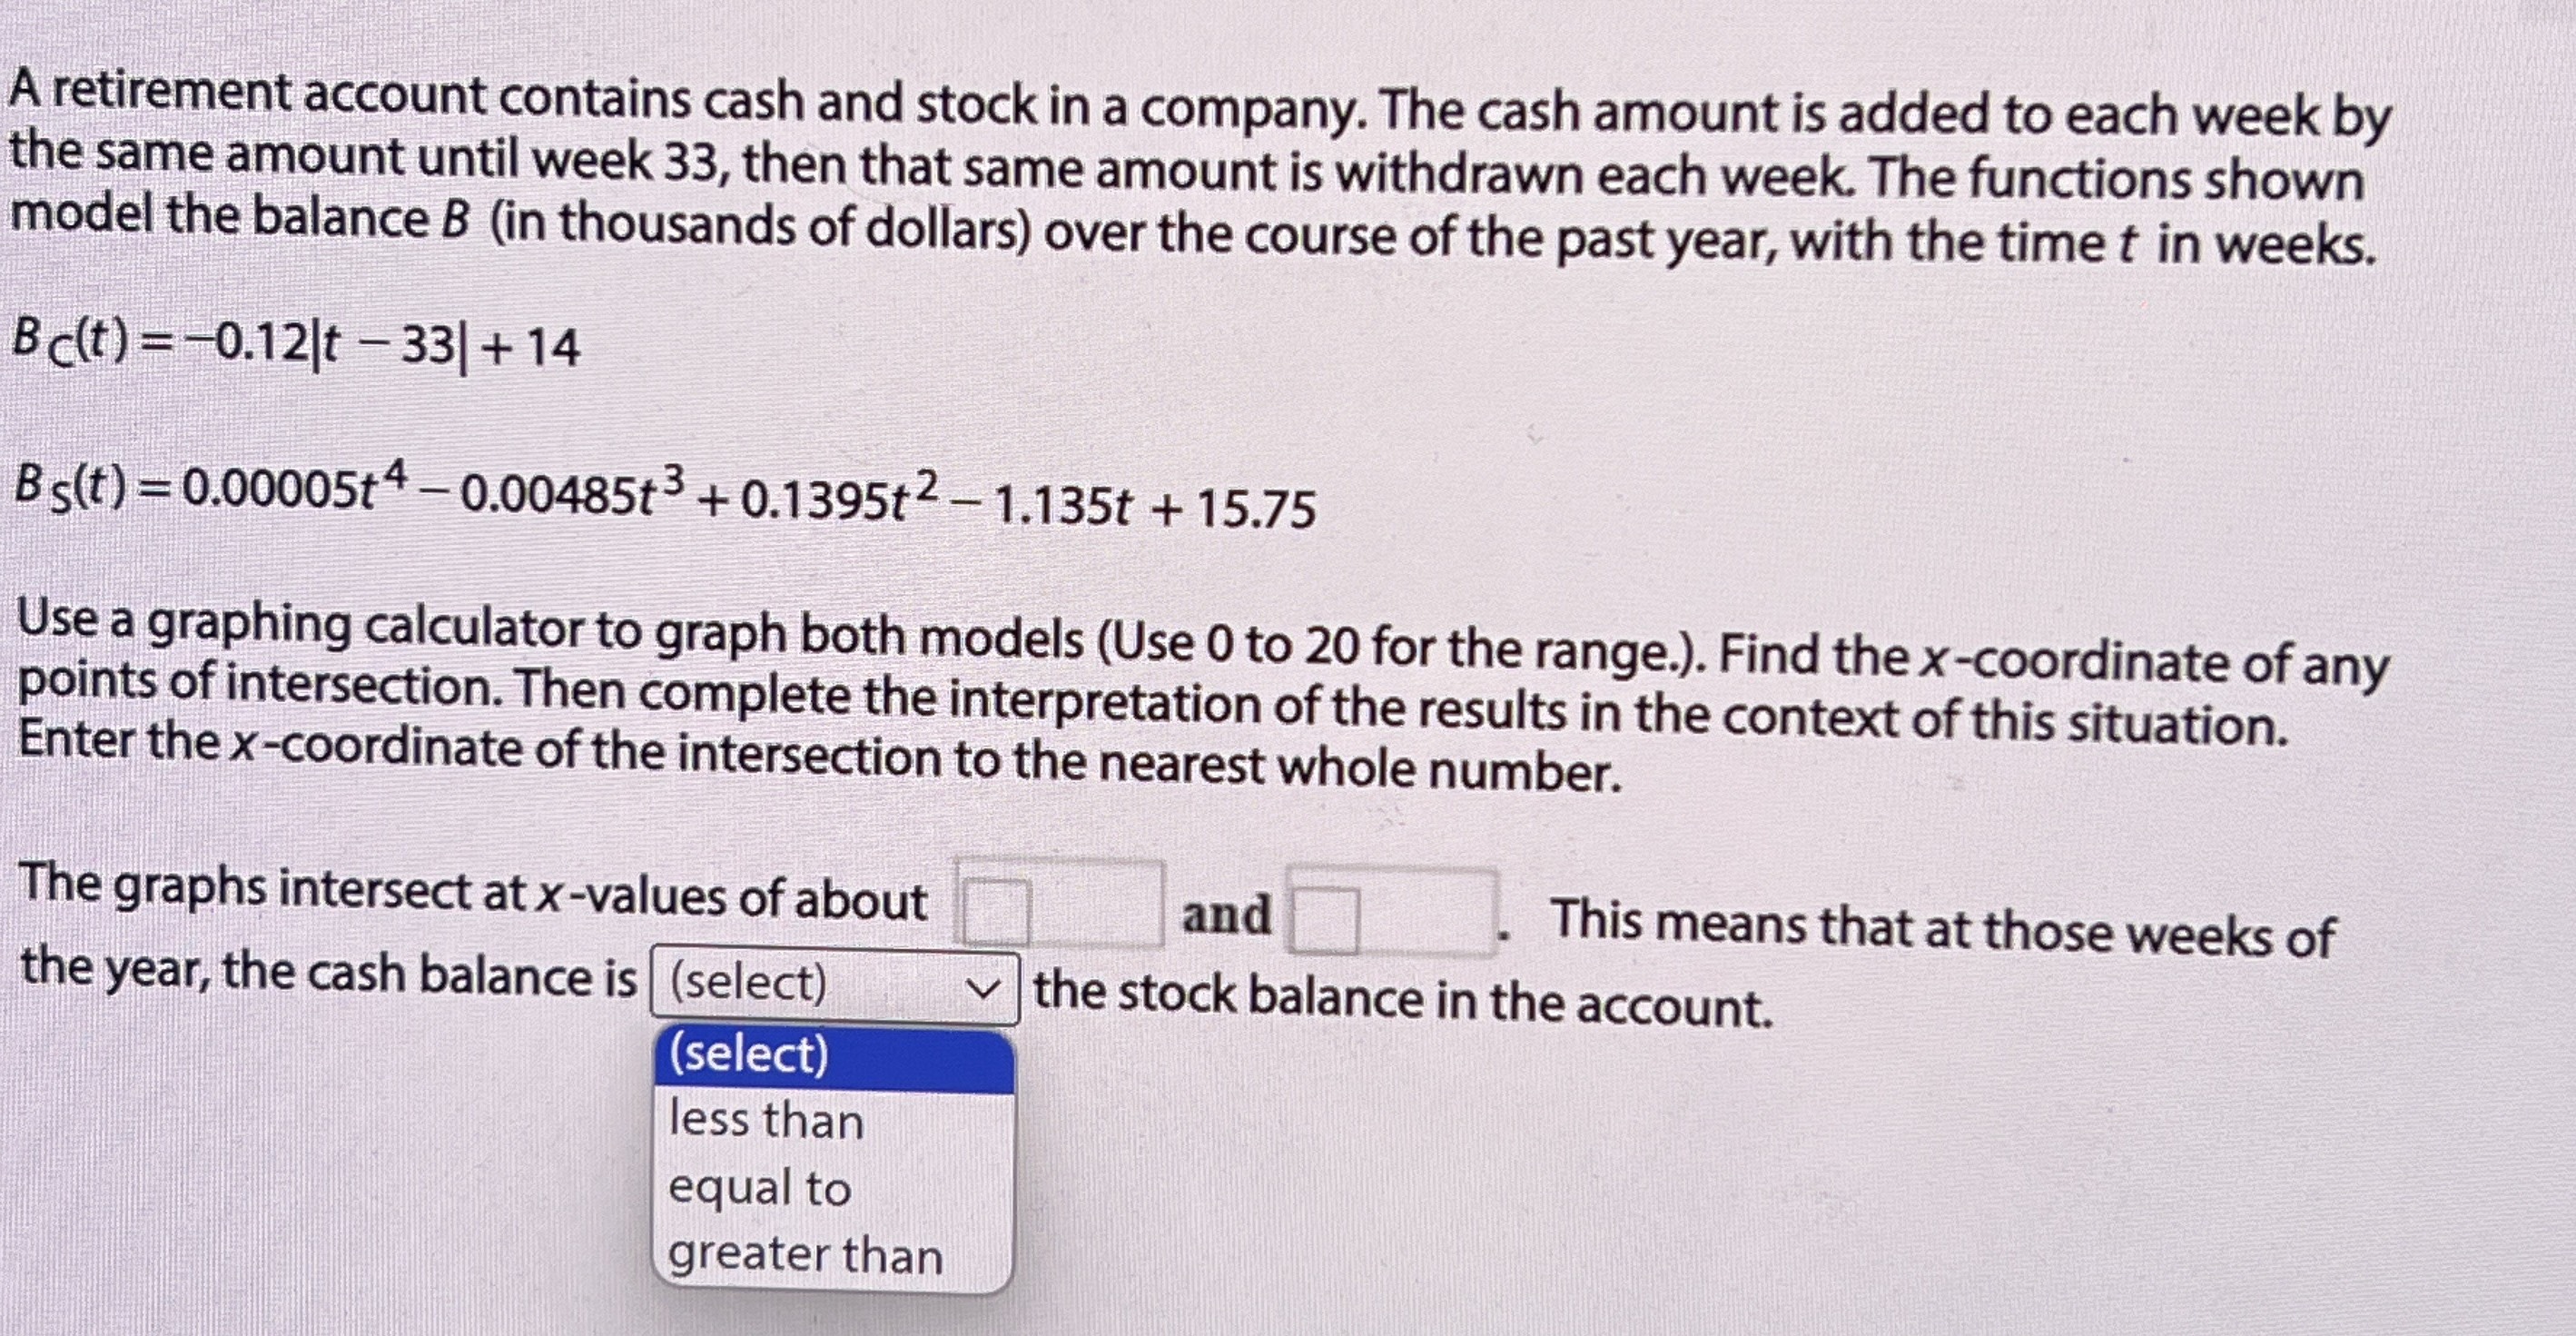
A retirement account contains cash and stock in a company. The cash amount is added to each week by the same amount until week 33 , then that same amount is withdrawn each week. The functions shown model the balance \( B \) (in thousands of dollars) over the course of the past year, with the time \( t \) in weeks. \[ B_{C}(t)=-0.12|t-33|+14 \] \[ B_{S}(t)=0.00005 t^{4}-0.00485 t^{3}+0.1395 t^{2}-1.135 t+15.75 \] Use a graphing calculator to graph both models (Use 0 to 20 for the range.). Find the \( x \)-coordinate of any points of intersection. Then complete the interpretation of the results in the context of this situation. Enter the \( x \)-coordinate of the intersection to the nearest whole number. The graphs intersect at \( x \)-values of about and This means that at those weeks of the year, the cash balance is (select) \begin{tabular}{l} (select) \\ \hline less than \\ equal to \\ greater than \end{tabular} the stock balance in the account.
UpStudy ThothAI Solution
 Tutor-Verified Answer
Step-by-step Solution
Quick Answer


Enter your question here…