Cook Mcdonald
09/18/2024 · Middle School
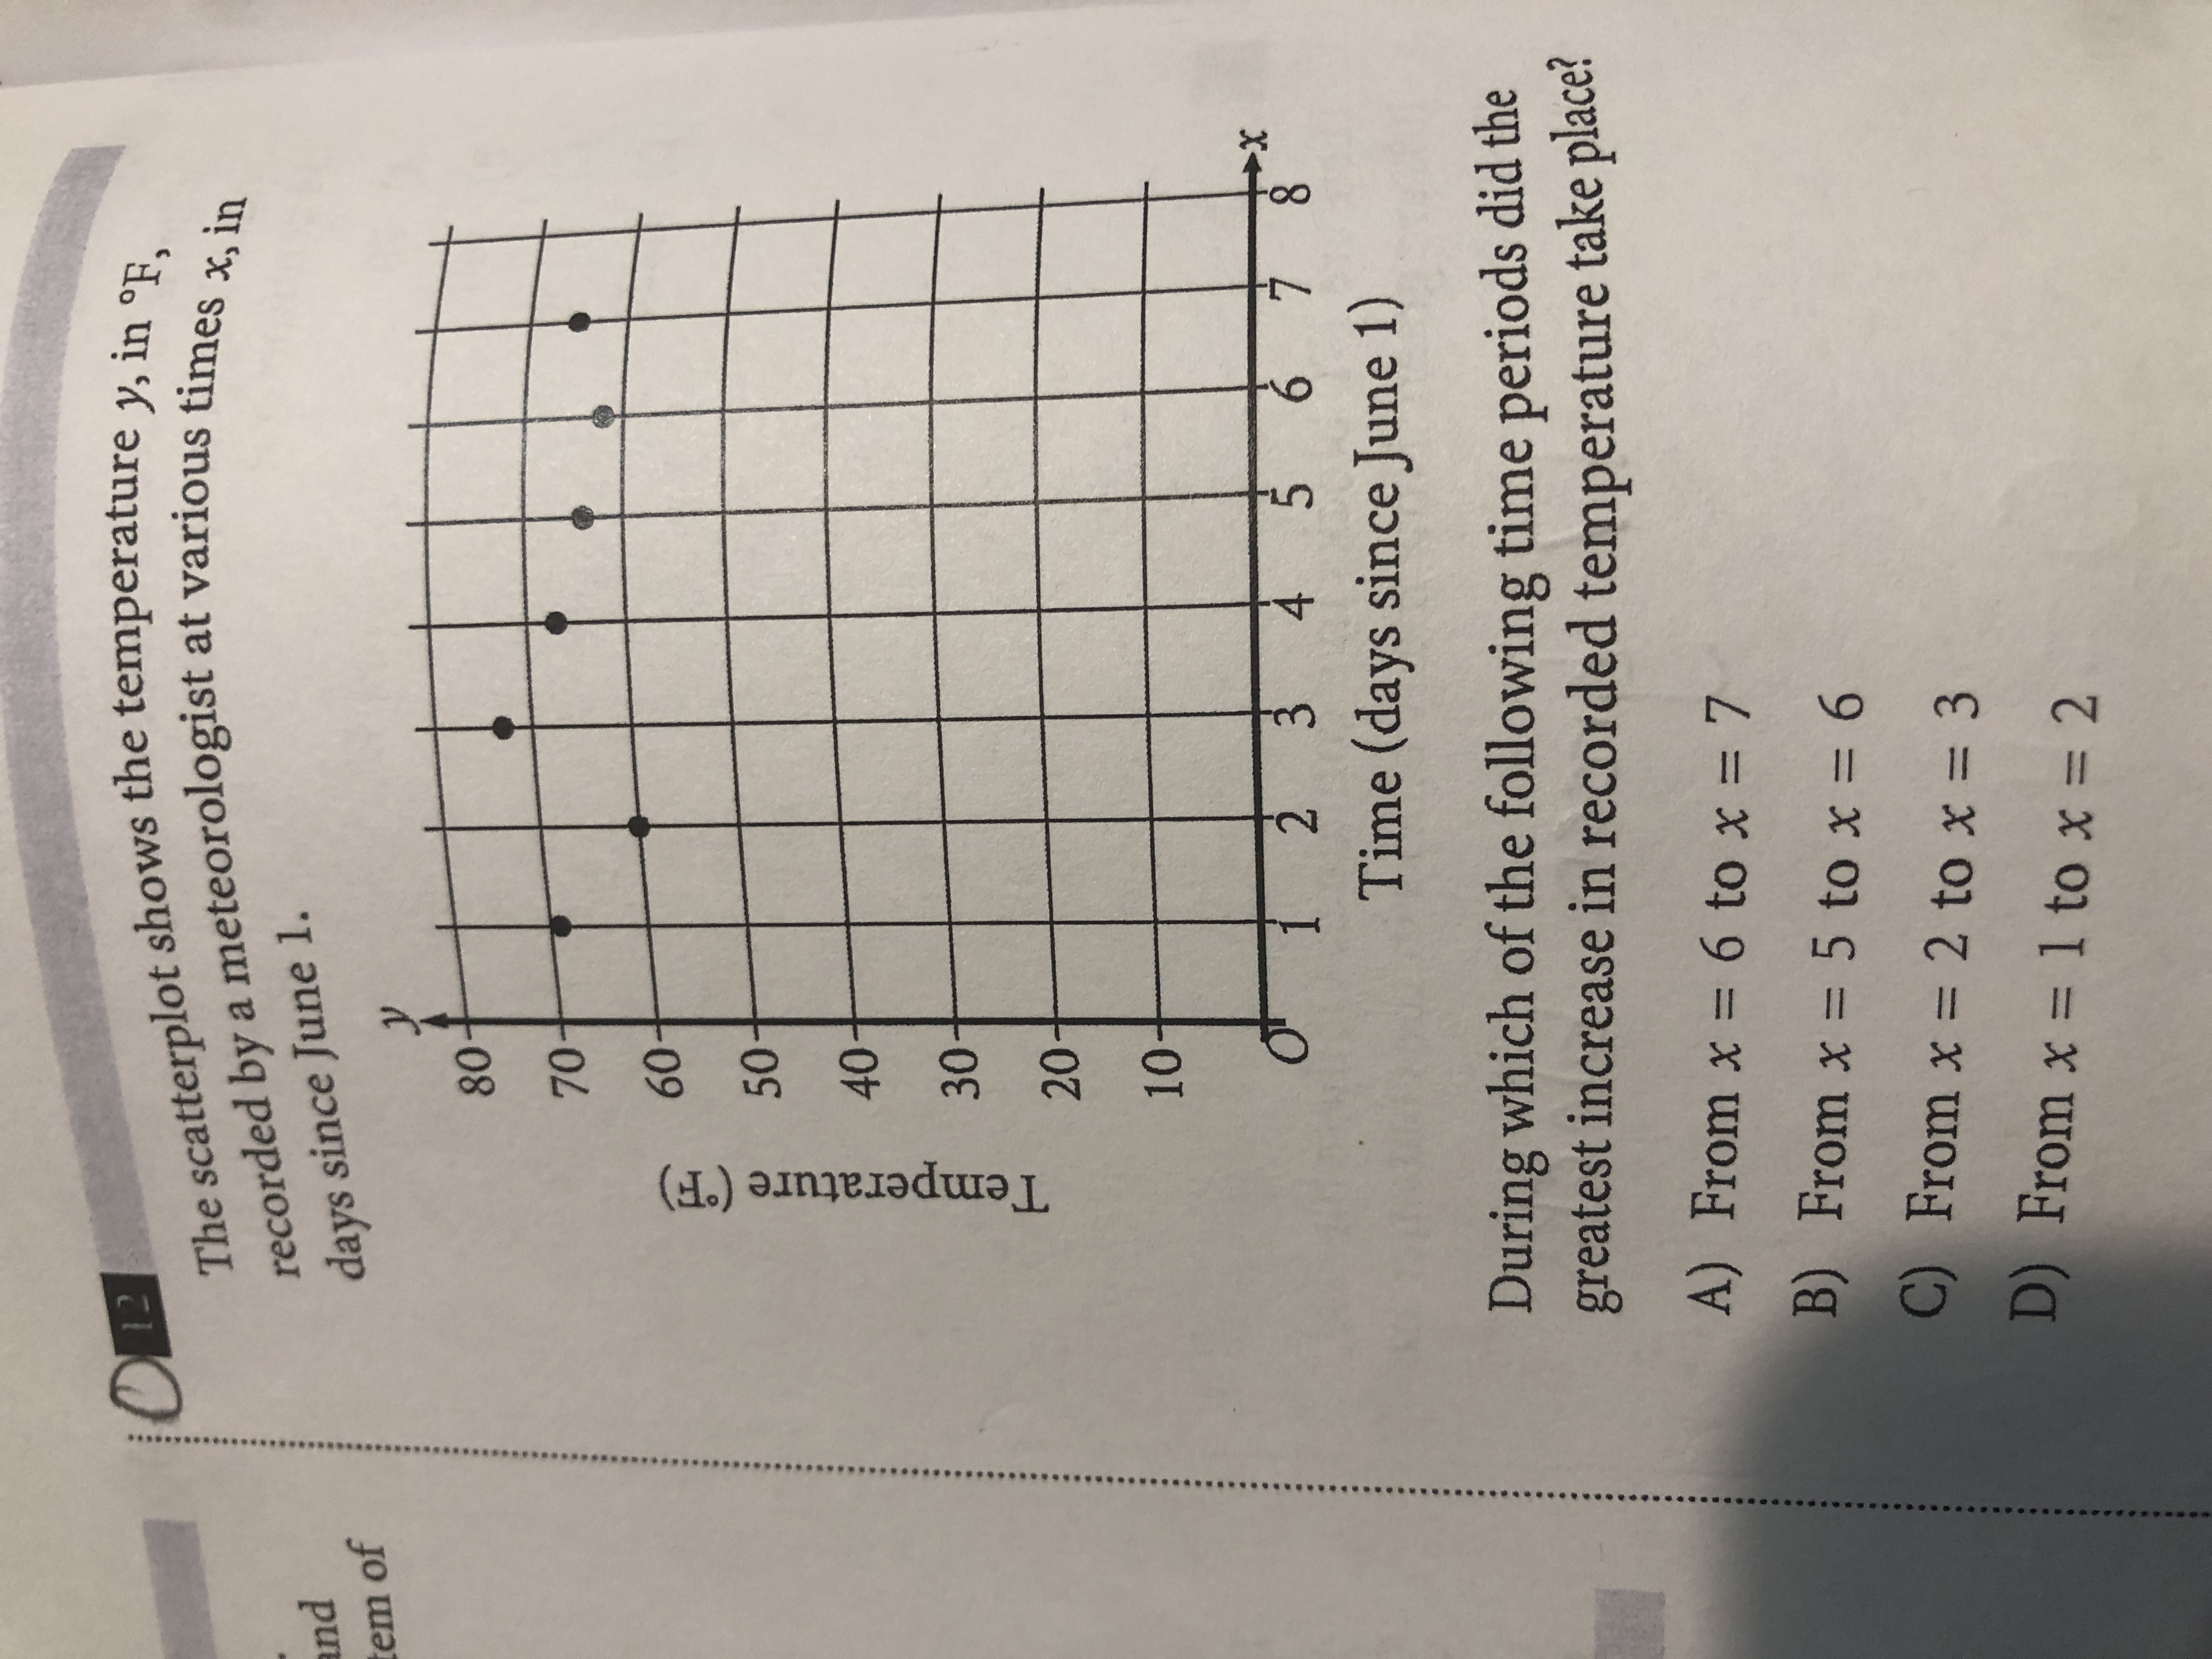
O12 The scatterplot shows the temperature \( y \), in \( { }^{\circ} \mathrm{F} \), recorded by a meteorologist at various times \( x \), in days since June 1. During which of the following time periods did the greatest increase in recorded temperature take place? A) From \( x=6 \) to \( x=7 \) B) From \( x=5 \) to \( x=6 \) C) From \( x=2 \) to \( x=3 \) D) From \( x=1 \) to \( x=2 \)
UpStudy ThothAI Solution
 Tutor-Verified Answer
Quick Answer
All time periods had the same greatest increase in temperature.
Step-by-step Solution
Answered by UpStudy AI and reviewed by a Professional Tutor
Ask Real Tutor
UpStudy ThothAI

Self-Developed and Ever-Improving
Thoth AI product is constantly being upgraded and optimized.

Covers All Major Subjects
Capable of handling homework in math, chemistry, biology, physics, and more.

Instant and Accurate
Provides immediate and precise solutions and guidance.
Try Now
Ask Tutors
Ask AI
10x
Fastest way to Get Answers & Solutions
By text
Enter your question here…
By image
Uploaded Files
xxxx.png0%
Submit