Standard Deviation Calculators
Knowledge
Standard deviation definition
Standard deviation is a measure of the amount of variation or dispersion of a set of values. It tells us to what degree a set of numbers are dispersed around an average. The higher the standard deviation value, the more widely distributed the values are in the sample. Conversely, the lower the standard deviation value, the more tightly clustered these values are.
So, what is low standard deviation? And what’s the difference of low vs. high standard deviation? A low standard deviation indicates that the values tend to be close to the mean (also called the expected value) of the set, while a high standard deviation indicates that the values are spread out over a wider range.
Population standard deviation and sample standard deviation
Standard deviation may be abbreviated SD, and is most commonly represented in mathematical texts and equations by the lower case Greek letter sigma “σ”, for the population standard deviation, or the Latin letter “s”, for the sample standard deviation. Different formulas are used for calculating standard deviations depending on whether you have data from a whole population or a sample.
•What is the population standard deviation?
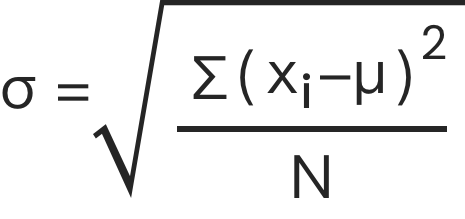
The population standard deviation is the experimental standard deviation under infinitely many measurements, also known as the theoretical standard deviation. A small overall standard deviation “σ” value indicates that the measured values are relatively concentrated, and a large “σ” value indicates that the measured values are relatively scattered. Below is the population standard deviation formula:
•What is the sample standard deviation?
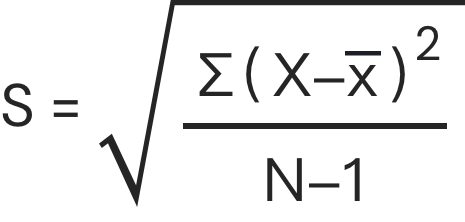
The sample is a part of the individual observed or investigated, and the population is the whole of the research object. In a real scenario where standard deviation is applied, it is impractical to find the true standard deviation of an aggregate, except in some special cases. Therefore it is necessary to take a sample data from a large set of data, which is the sample standard deviation. Below is the sample standard deviation formula:
How to solve the standard deviation?
Standard deviation is usually calculated automatically by software used for statistical analysis, such as UpStudy standard deviation calculator. But you can also do the calculations by hand to better understand how the formula works.
Here are the steps to calculate the standard deviation:
Step 1: find the mean, add up all the scores, and divide them by the number of scores (click to learn how to calculate the mean).
Step 2: subtract the mean from each score to get the deviations from the mean, then square each deviation from the mean.
Step 3: find the sum of squares and the variance.
Step 4: the square root of the variance is the standard deviation.
Does it sound difficult? Actually not, now let's take a look at the following standard deviation examples to practice.
Example 1
Population standard deviation of grades of eight students.
Suppose that the entire population of interest is eight students in a particular class. For a finite set of numbers, the population standard deviation is found by taking the square root of the average of the squared deviations of the values subtracted from their average value. The marks of a class of eight students (that is, a statistical population) are the following eight values: (2,4,4,4,5,5,7,9).
Solution:
First, calculate the mean. These eight data points have the mean of 5:
μ = 2+4+4+4+5+5+7+9 8 = 40 8 = 5.
Second, calculate the deviations of each data point from the mean, and square the result of each:
(2-5)2 = (-3)2 = 9
(4-5)2 = (-1)2 = 1
(4-5)2 = (-1)2 = 1
(4-5)2 = (-1)2 = 1
(5-5)2 = 02 = 0
(5-5)2 = 02 = 0
(7-5)2 = 22 = 4
(9-5)2 = 42 = 16
Third, the variance is the mean of these values:
σ2 = 9+1+1+1+0+0+4+16 8 = 32 8 = 4.
Finally, the population standard deviation is equal to the square root of the variance:
σ = 4 = 2.
Example 2
A sample of 444 students was taken to see how many pencils they were carrying.
Calculate the sample standard deviation of their responses: 2, 2, 5, 7.
Solution:
First, find the mean.
x = 2+2+5+74 = 164 = 4
Second, subtract the mean from each score and square each deviation.
(2-4)2 = (-2)2 = 4
(2-4)2 = (-2)2 = 4
(5-4)2 = (1)2 = 1
(7-4)2 = (3)2 = 9
Third, divide the sum by one less than the number of data points then take the square root of the result.
4+4+1+9 = 18
184-1 = 183 = 6
s = 6 ≈ 2.45